
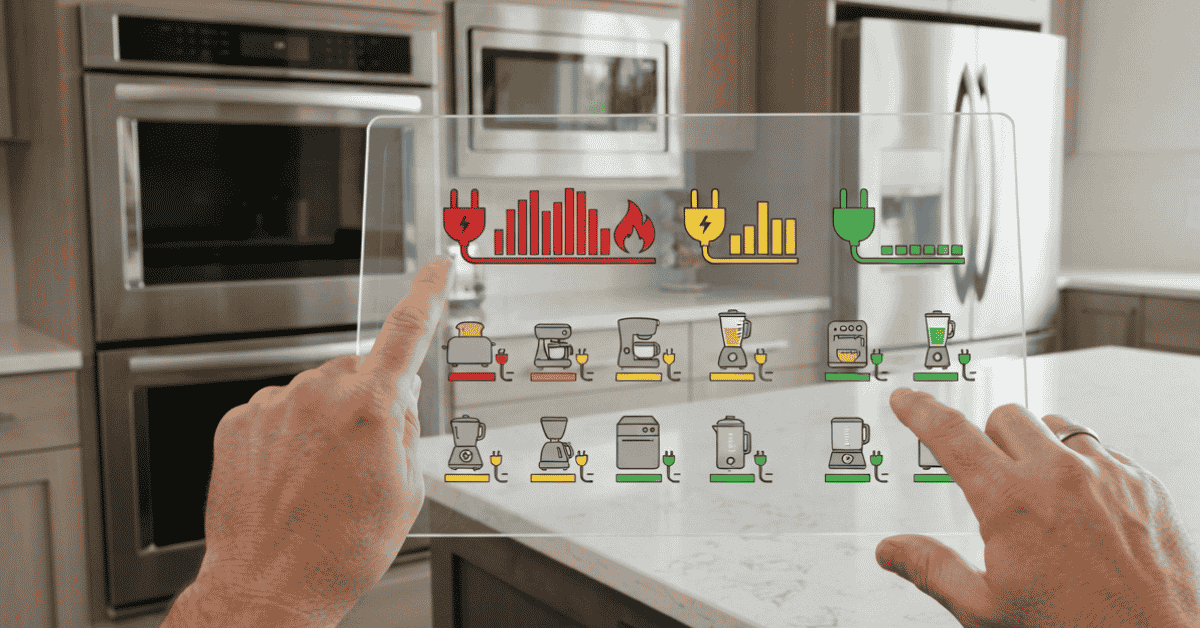
home appliance wattage chart guide with common watt ranges, usage clues, simple energy math, and practical tips for lowering household power use.
Home appliance wattage chart numbers once confused me completely. A kettle showed huge watts, while my fridge seemed mild. Yet the fridge ran through every quiet night. That contrast made me question my old assumptions. I began tracking watts beside real daily running time. This guide shares the simple method that finally worked.
Can a Home Appliance Wattage Chart Really Help?
I first made a wattage chart after one odd bill. The paper sat beside my warm coffee mug. A ceiling fan made a dull hum overhead.
I wrote every large appliance across one page. Then I added the watt rating beside each name. Some results felt almost backward at first.
My kettle had a surprisingly high power rating. The refrigerator showed less power during active operation. Yet their daily use patterns were completely different.
That was the point I had been missing. Wattage shows power demand at a given moment. It does not show total monthly energy alone.
A useful chart needs watts and realistic runtime together. Once I understood that, the numbers became much friendlier.
Life Before I Found This
Before making a chart, I blamed random household devices. Chargers became my first target for almost no reason.
The fridge clicked softly during late quiet nights. My toaster smelled warm and slightly burnt each morning. The washing machine shook the floor during fast spins.
I judged power use through noise, heat, and size. That method felt sensible, yet it fooled me often.
A loud device might run for five minutes. A quiet device could cycle throughout every single day.
I needed numbers, not guesses based on sound. That small shift made household power feel far less mysterious.
Why This Matters Right Now
Homes keep gaining more devices that need electric power. Kitchens alone can hold several high-watt appliances today.
Home offices add monitors, routers, printers, and charging gear. Bedrooms may include fans, heaters, TVs, and air units. Laundry areas can hold washers, dryers, and irons.
Each item seems harmless when viewed by itself. The full load becomes clearer once everything gets listed.
A home appliance wattage chart gives that overview quickly. It can highlight devices with large power demands. It can also expose long-running loads worth checking first.
I like that because it keeps my effort focused. I would rather address one major load than worry endlessly.
The First Big Lesson
The first big lesson was separating watts from energy. I used to mix those ideas together constantly.
Watts describe the rate an appliance uses power. Energy use depends on watts plus running time.
A 1,000-watt device running one hour uses about one kilowatt-hour. A 100-watt device running ten hours does the same.
That simple example changed the way I read charts. High wattage is not automatically bad or wasteful.
Some high-power appliances perform short tasks very quickly. Electric kettles are a good example in many homes. Space heaters can be different because they run longer.
Runtime turns a plain watt number into useful context. I now write estimated hours beside every chart entry.
Without time, a wattage chart tells only half the story.
Small Tactics That Actually Work
I start with the rating label on each appliance. Most products list watts, volts, amps, or similar details.
Next, I record realistic daily or weekly runtime. I avoid pretending every appliance runs at full power constantly.
Cycling appliances need special care during rough estimates. Refrigerators and air units switch compressors on and off. Their rated watts do not represent nonstop full-load use.
I then convert rough use into kilowatt-hours. Watts multiplied by hours gives watt-hours first. Dividing that total by 1,000 gives kilowatt-hours.
For plug-in devices, an energy meter can help. Real measurements often beat guesses based on labels.
I also repeat tracking across several normal days. One strange day can create a very misleading result.
A Strange Detail I Noticed
The strangest thing was my fear of the kettle. Its watt rating looked huge on my chart.
Each morning, water roared inside its metal body. Steam rose fast and warmed my fingertips nearby. It looked and sounded like an energy monster.
Then I considered the actual running time. The kettle worked for only a few short minutes.
My fridge felt almost invisible by comparison. It stood quietly under a soft kitchen light. Yet it cycled through every hour of every day.
That contrast still sticks with me now. Our senses can be poor judges of energy use.
Quiet loads deserve attention just like loud ones.
Style Comparison & Data
These figures are broad examples for common home appliances. Exact wattage varies by size, model, and operating mode.
| Home appliance | Typical watt range | Common use pattern |
|---|---|---|
| Refrigerator | 100-400 watts | Cycles day and night |
| Microwave | 600-1,500 watts | Short daily bursts |
| Electric kettle | 1,200-1,500 watts | A few minutes |
| Washing machine | 400-1,400 watts | Several weekly cycles |
| Space heater | 750-1,500 watts | Longer seasonal use |
The table makes one important point very clear. Similar wattage can produce very different total energy use. Runtime remains the missing piece in every fair comparison.
Non-Obvious Gains
Making a wattage chart gave me some unexpected benefits. Saving power was only one part of it.
- Large household loads became easier for me to identify.
- Small devices stopped causing pointless energy anxiety.
- Appliance replacement choices gained useful power context.
- Family power habits became easier to discuss calmly.
- Backup power planning became much easier to estimate.
- Circuit loads made more sense during appliance use.
- Seasonal bill changes became easier to understand later.
The biggest gain was probably mental clarity. I stopped guessing which appliance deserved my attention.
A plain chart made the whole house feel measurable.
Myths vs. My Reality
I used to think high watts meant huge bills. But then runtime changed nearly every comparison I made.
I used to think small devices barely mattered. But then long use made some loads surprisingly meaningful.
I used to think refrigerators drew rated power nonstop. But then cycling behavior made the picture more complex.
I used to think noise meant high power demand. But then several quiet loads proved that idea wrong.
I used to think every appliance chart was exact. But then model differences became impossible to ignore.
My reality became more practical after that. A wattage chart is a starting point, not proof. Real use depends on settings, runtime, size, and design.
I now use charts to find questions worth checking.
Essential Principles for Mastery
I follow six simple rules when building any wattage chart. First, use the actual appliance label when possible.
Second, keep rated watts separate from total energy use. A power number needs runtime before it becomes meaningful.
Third, compare similar appliances with similar sizes. A compact refrigerator cannot fairly match a huge model.
Fourth, mark cycling devices clearly on your chart. Their compressors or heating parts may not run nonstop.
Fifth, use normal household habits for time estimates. Ideal lab conditions rarely match a busy real home.
Sixth, measure uncertain devices when accurate data matters. Plug-in energy meters can help with many smaller appliances.
I also avoid chasing tiny loads before larger ones. Heating, cooling, cooking, and drying can deserve closer attention.
The goal is not to fear electricity use. The goal is to understand where it actually goes.
FAQs About Home Appliance Wattage Chart
What Is a Home Appliance Wattage Chart?
A home appliance wattage chart lists common devices and their estimated power demand in watts. I use it for quick comparisons, but exact ratings should come from each appliance label or manual.
Which Home Appliances Usually Have High Wattage?
Electric heaters, kettles, ovens, dryers, microwaves, and some air units can have high ratings. I still check runtime because a high-watt device used briefly may consume less total energy.
Does Refrigerator Wattage Stay Constant All Day?
No, most refrigerators cycle during normal operation. The compressor turns on and off as cooling is needed. I avoid multiplying rated watts by twenty-four hours without accounting for cycling.
How Can I Estimate Daily Appliance Energy Use?
Multiply watts by estimated hours of operation first. Then divide that result by 1,000 to get kilowatt-hours. I treat this as a rough estimate because real appliance loads can change.
Can a Wattage Chart Help With Generator Sizing?
Yes, a chart can provide an initial load estimate. Starting power can differ from normal running watts for some devices. I would check exact equipment ratings before choosing backup power capacity.
My Final Takeaway
A home appliance wattage chart makes power use easier. It gives me a clear place to start comparing devices.
I check watts first, then add realistic running time. I treat cycling loads differently from steady loads. Exact appliance labels always beat broad online estimates.
Maybe the highest watt number will surprise you. Just remember that watts alone do not tell everything. Time turns that number into the story that matters.